D3.js and Vue.JS
In this blog, I will describe how you can integrate D3 into Vue.js. D3 is a popular JavaScript library for visualising data using web standards (HTML, CSS, JavaScript, and SVG). Vue.js is a rising star in the front-end and has lately gained a lot of popularity in the web development scene. It’s a front-end framework similar to React and Angular and allows you to build scalable user interfaces.

I’m learning D3 as I go, and I’ve used Vue.js a lot in the last few months, I thought it would be good to practice how I can combine the two. I’m still learning and improving my D3 skills so I think that if I revisit this post in a few months I’ll see mistakes or things I would change, so please highlight any issues or suggestions in the comments below.
I borrowed the chart that I’m recreating for this blog post from Elijah Meeks (image below), who wrote an excellent book about D3.js called ‘D3.js in Action’. If you want to learn more about this JavaScript library then this should be your first stop (so yeah, definitely buy this one).
In Chapter 9 he writes about integrating D3 with React, and I have seen a lot of good examples of this combination on GitHub and B.locks. But there aren’t that many resources around integrating D3 with Vue.js. I found a few other articles on Medium and one on B.locks but the best one so far was this repo from Shirley Wu, who is a freelance software engineer and data visualisation expert.
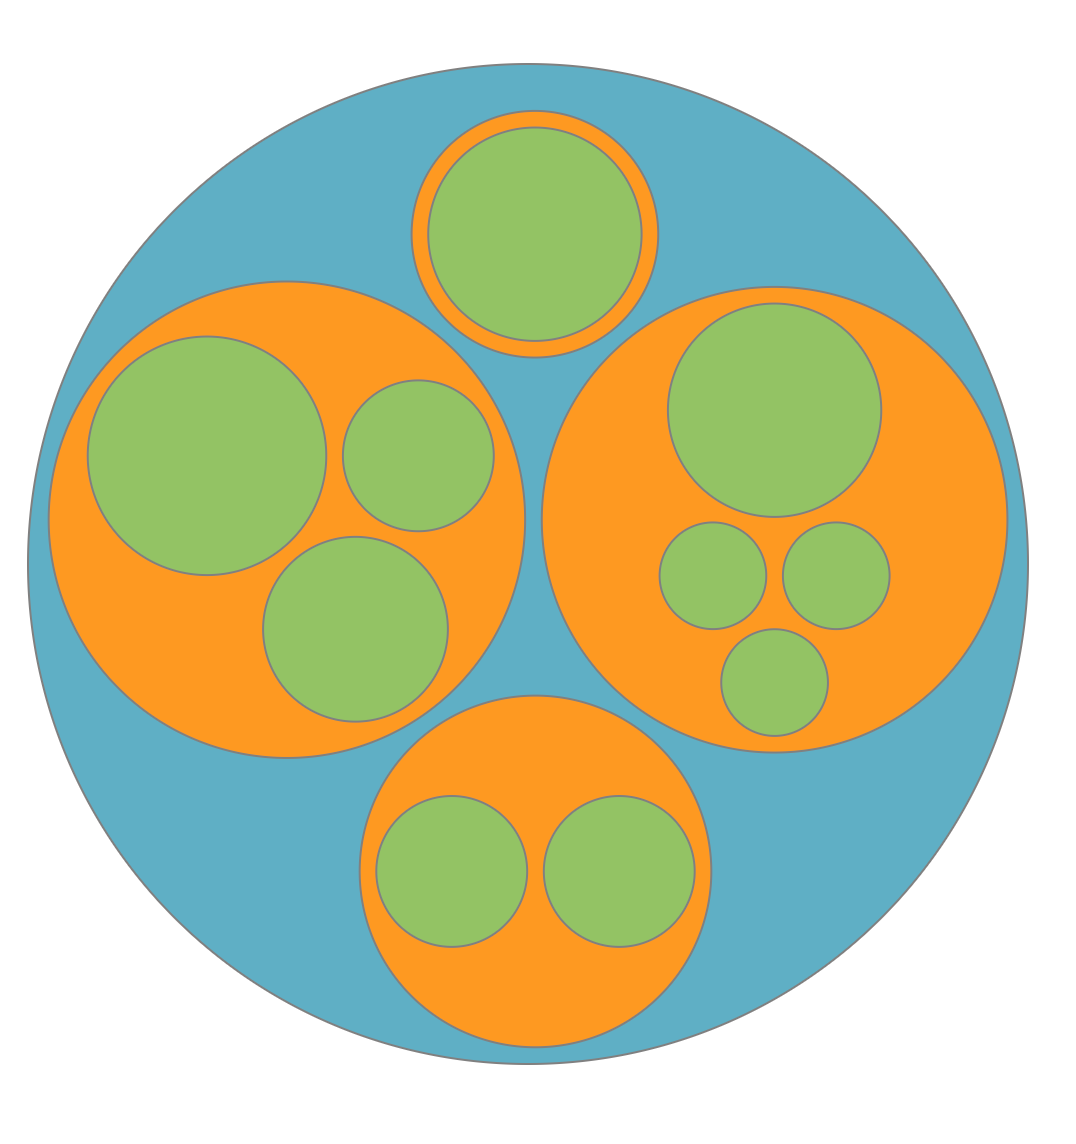 ‘Circle Chart’ for displaying hierarchical data - taken from Chapter 6.3.1 from D3js in Action
How to get started with Vue
Let’s get started with scaffolding a Vue Project — this is similar to create-react-app for those that come from a React world. I’m using Vue CLI version 3. If you don’t have it installed then please run:
$ npm install -g @vue/cliI know that using the CLI for just one chart component is a bit overkill but I suppose you’re going to integrate D3 in a bigger application for which you want to use all Vue functionality. The -g flag means you’re installing it globally on your machine so there’s no need to run this again the next time you use Vue. After installing Vue it’s time to create a new project. Run the following lines one by one in your terminal:
$ vue create d3-vue-example
$ cd d3-vue-example
$ npm run serve
With npm run serve you’re starting a development server with ‘hot reload’ enabled. This means that when you make changes in almost all of the files the changes are immediately displayed. Once you got this server running it’s time to install D3. You can do that like so:
$ npm i --save d3If you open up the d3-vue-example folder in your favourite editor (I use VS Code) then you see a bunch of files and folders listed. For now it’s important that the package.json file is there. This is where all the packages appear that you install through npm. D3 should now also show up under dependencies in this package.json file.
Create a chart component
The most important files and folders for us are in the src folder. App.vue is the main entrance to your application. In this file, you want to import all the components that you create. By default you see only one component being imported here; the HelloWorld. This component file is located in the components subfolder. It’s best practice to put all your components in this folder.
Let’s also create a Chart.vuefile in this folder. Then go back into your App.vue file and duplicate line 9 and replace HelloWorld with the newly created Chart file. After this you have to add Chart to the components property of the JavaScript Object that is being exported in this file. The next step is to reference this component in the template section of theApp.vue file.
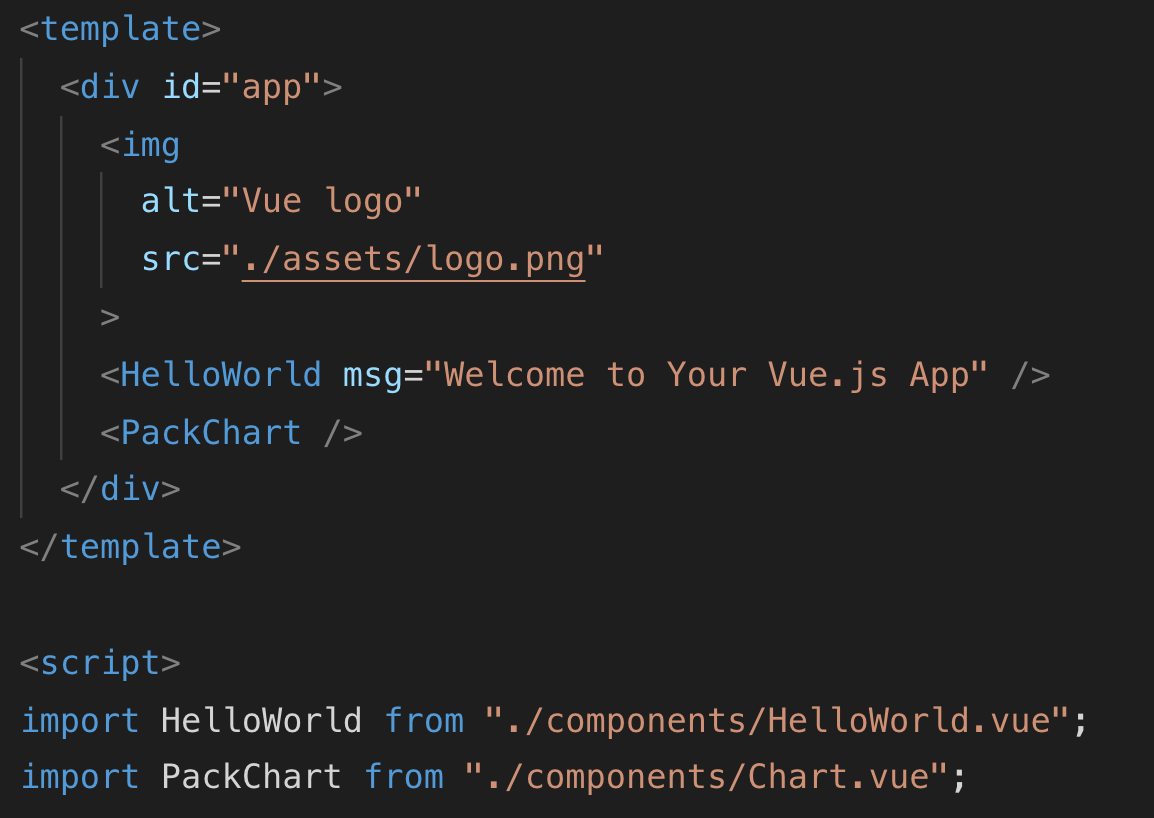 Component ‘PackChart’ is being imported in App.vue and used in the template
Okay, that might have confused you a bit if you’re new to front-end frameworks and working with npm. Head over to my Github page to find the source code if you want a full look.
Go to your localhost port 8080 (http://localhost:8080) and there you’ll be welcomed with the Vue default template. If you’re new to Vue.js then this new file extension .vue might look a bit foreign. Actually, this is the beauty of Vue — within this one file you create your own components and have all your HTML (template), JavaScript, and CSS together. Going over all the basics of Vue is too much for this blog so I recommend spending some time with this course on Udemy from Maximilian Schwarzmüller.
Adding D3 to Vue I tend to import D3 in all the components that I create (including App.vue) but it’s probably best practice to not do this and just import it once, or only import the elements of the API that you need. An explanation of the module import of D3 can be found here. You can import D3 in each component by referencing it in the top of the script section of the vue file like so:
import * as d3 from "d3";Another way would be to include the CDN link in the head section of the index.html file but it is best practice to use the node modules. Although with the CDN method it would then mean you can use it everywhere in your application.
Build out the Chart component
If you go back to your App.vue file then we’ll set up data props. Props are the data you want to send from your parent component, the App.vue file, to your child components, in this case Chart.vue. Let’s first create a data property in which we’ll push the data (I called it loadData). We’re going to use the tweets.json file from Meeks’ book — you can get the file here. Once downloaded, move the file into the public folder in the project folder.
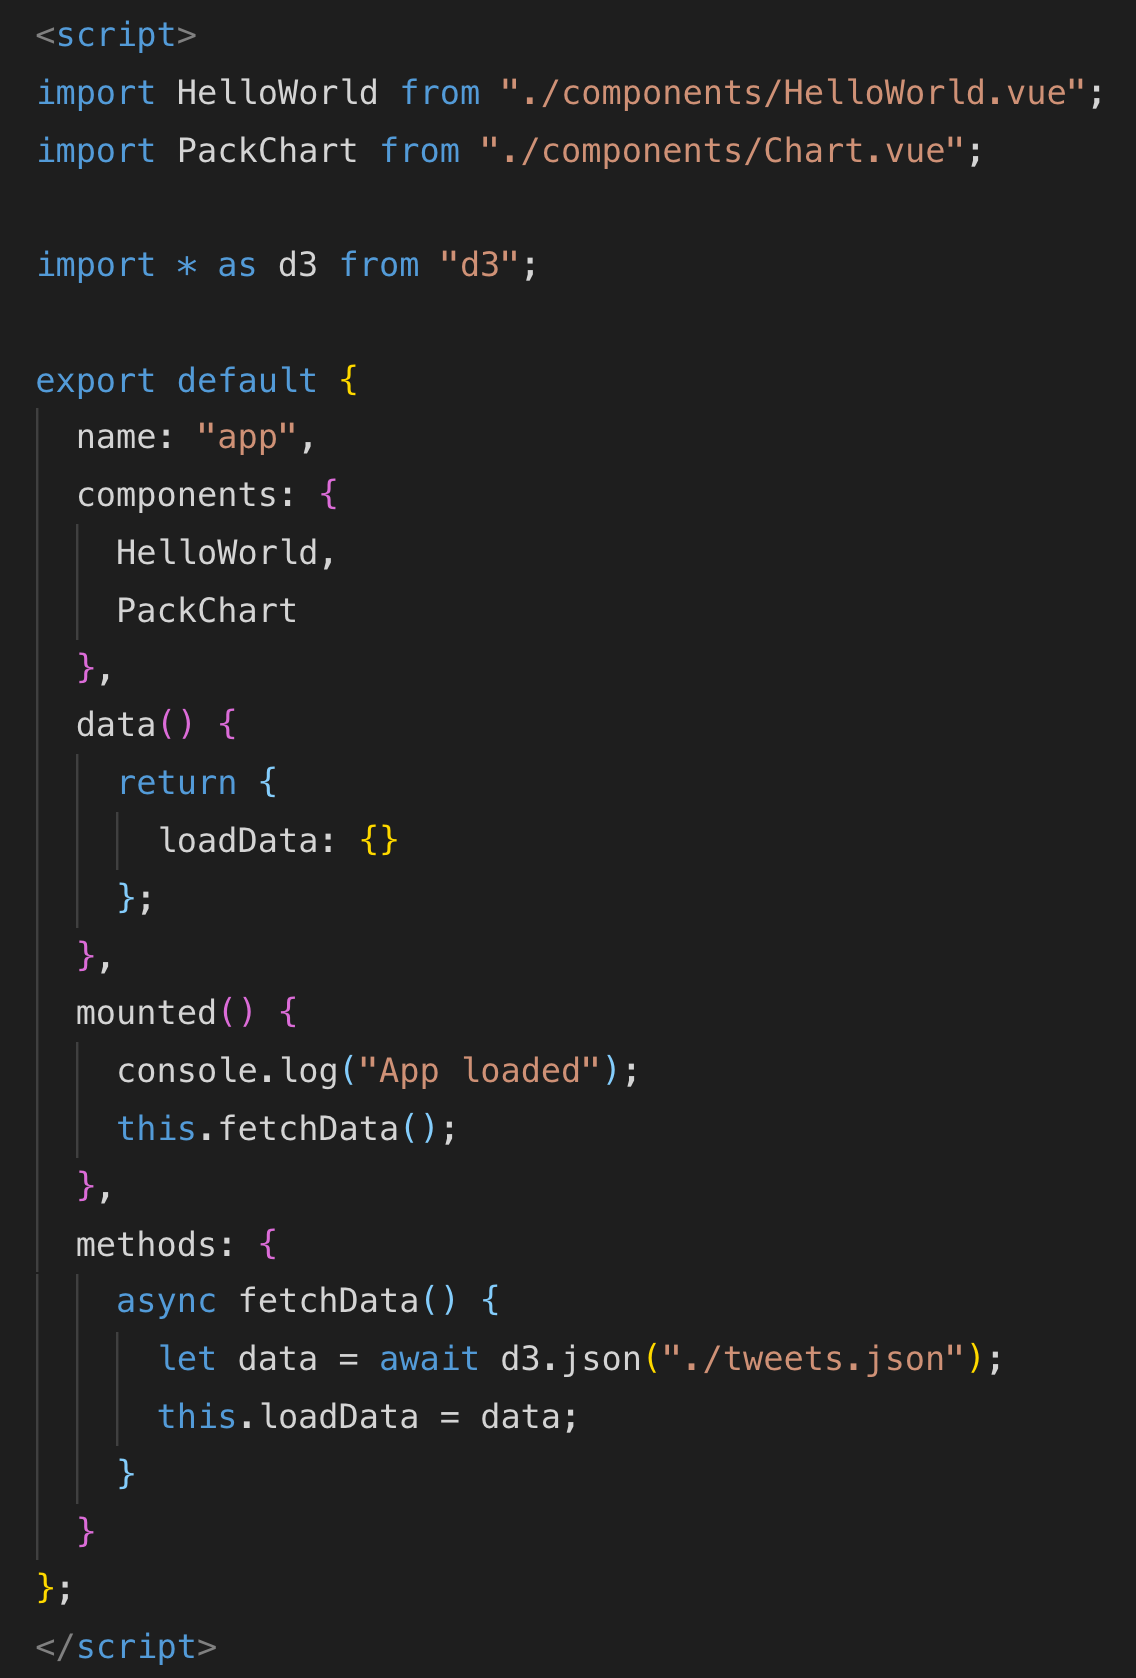 Load the data in App.vue when the app has mounted
Vue.js has several ‘life-cycle’ hooks. These correspond with the different ‘states’ of your application. In the image above you see the ‘mounted’ property in the Vue instance. When the application has loaded it adds all the properties it can find in the ‘data’ object to its Reactivity system. This means that if the data changes, your application also updates (it becomes reactive). If you’re new to front-end frameworks, it might be a bit difficult in the beginning to wrap your head around the concept of ‘state’ and how elements are being removed and updated. But if you’re familiar with D3 then this might ring a bell. Think of it as the whole ‘Enter-Update-Exit’ pattern.
Add this to the Chart.vue file
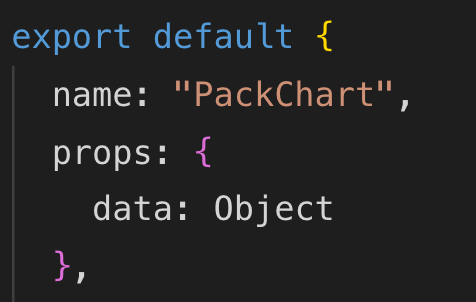
Back to the mounted object. In D3 version 5, we have to use promises to load our data. This makes life a lot easier because previously you would have to use callbacks that often became a bit messy. What mounted does in this case is load the data from the JSON file and make it available when the DOM is being ‘mounted’. After this, you need to add the data to the prop we created in the Chart.vue component (see image on the top). You then bind this prop to the Chart component in the App.vue file like so:
<PackChart :data=loadData />This means that whatever object is in ‘loadData’ is then being pushed into the child component that is the Chart.vue file (called the PackChart).
If you’re new to this Async/Await syntax of handling Promises then I would suggest watching this talk from Wes Bos.
Create the D3 chart
The first section of the script part of the Chart.vue file contains importing D3, return the data object (with a message that is displayed in the component, and the width and height of the SVG that contains the chart (1)). This width and height is then bound to the SVG in the template (2).
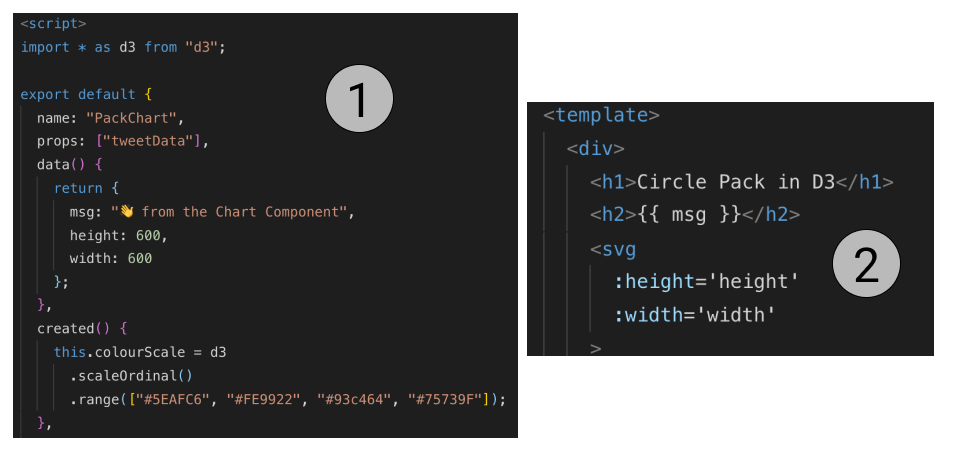 Width and Height of SVG specified in the data object of the Vue instance
In the ‘created’ life cycle hook, I am defining a scale function for the colours of the circle chart. Because we have a set list of nested bubbles (a discrete list) as input, we can use the scaleOrdinal scale. This scale then returns a discrete output of colours (the ones we define in the array). If you want to learn more about the different scales of D3, then I recommend heading over to this page.
The next step is to create a computed property in which we restructure the data so that we can use it as a hierarchy. D3 has several useful functions that can help you with making your data ready for charts that display hierarchies. One of them is the nest() function. What this does is turn a flat structure to a nested one (1 => 2). You can then define how to nest it (which property) and how deep to nest it. In our case, I use the ‘user’ as the top level property. This then means our new array contains four objects (one for each user).
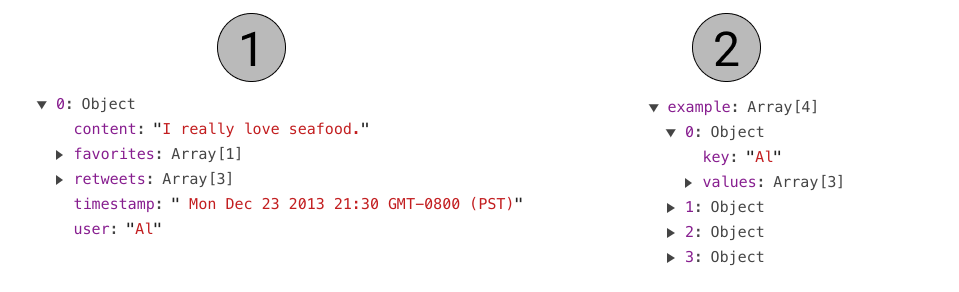 From one tweet per Object to one Object per user (with tweets as children) with
 nest()
In this same computed property, I’m using the hierarchy module. This module takes a root (the new object called packableTweets — see image below) and returns a new layout.
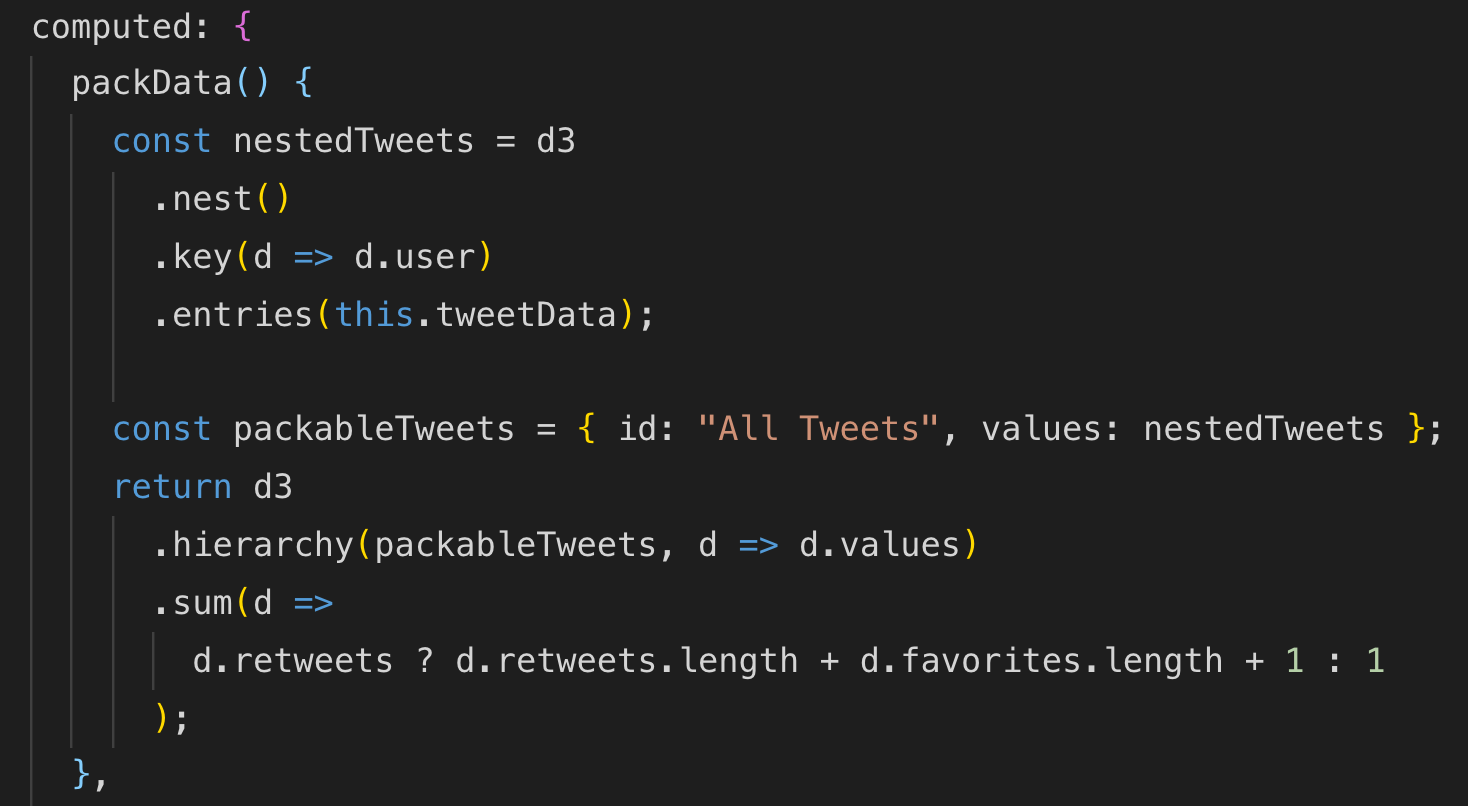 Creates the hierarchical structure as per previous image
In order to actually draw something on the screen, we need to return some data that can be bound to the SVG in the template. For that, I created another computed property that takes in the previous one (packData()) and returns an array of JS Objects with the x & y coordinates and the radius of the circles. It then also uses the colourScale defined in the created hook (see image below).
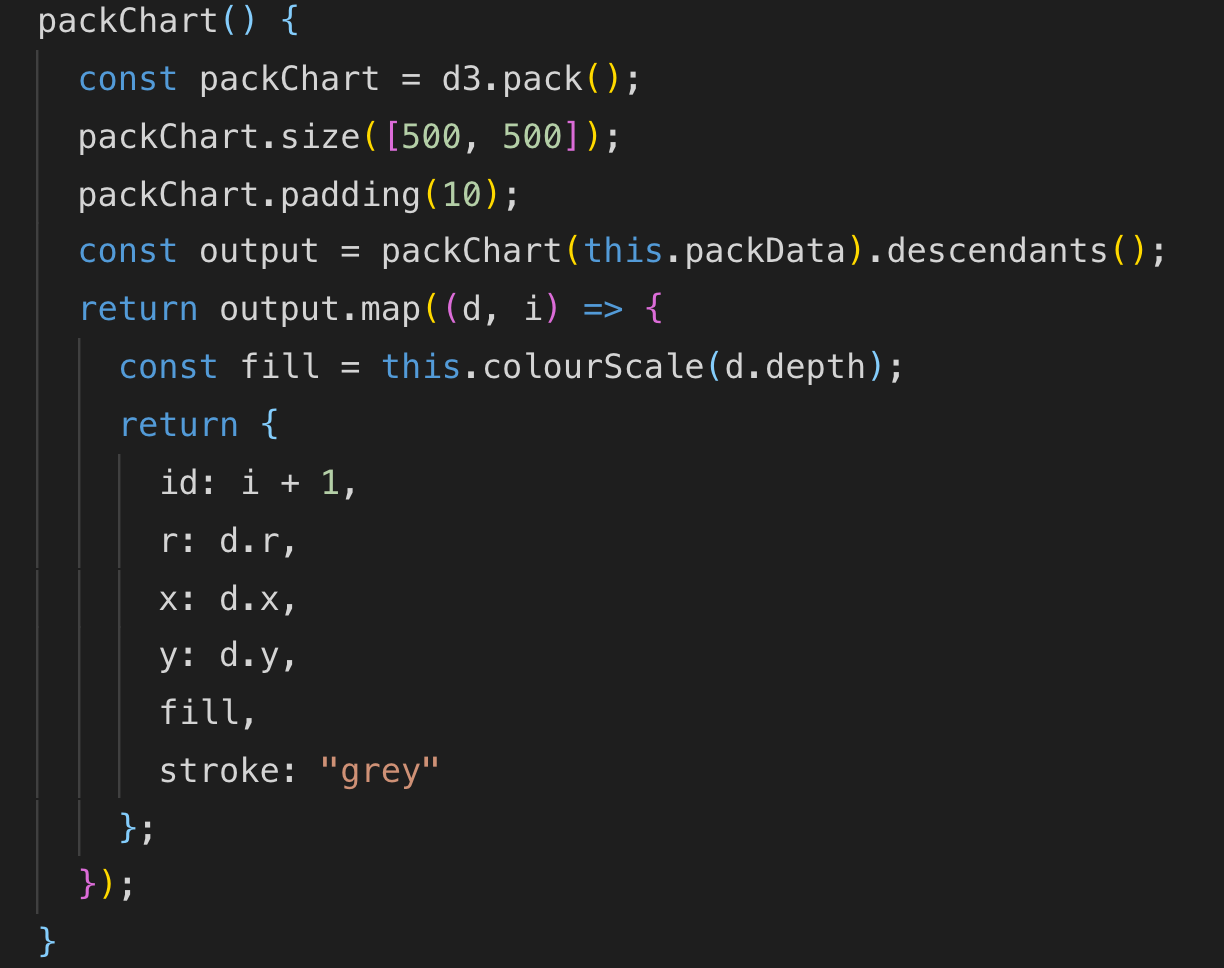 Returns an array of objects (containing the circle data)
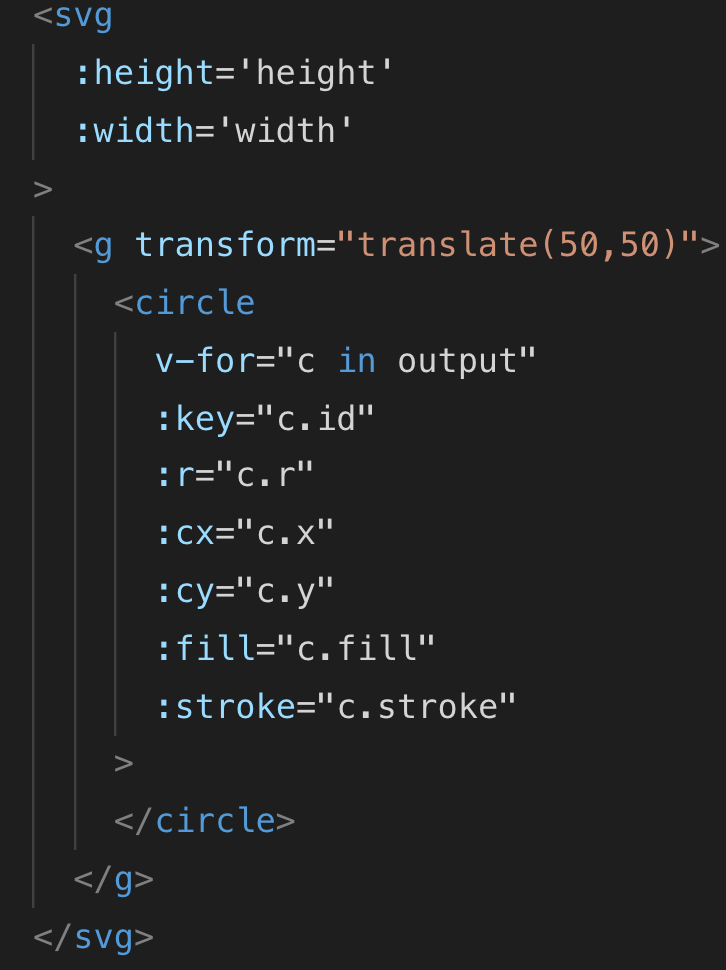
We can then loop over this array with the v-for directive and display the circles in the view with their corresponding x and y coordinates, their radius, and colour.
If you made it here then you’ve followed quite a lot of steps. If you got stuck along the way then I would recommend heading over to my GitHub and clone the repo and inspect the chart here. I’m open for feedback as I’m certain I’ve either overcomplicated things or overlooked elements in my code.